Spread Spectrum Communications
Overview
This white paper discusses the concept and techniques of spread spectrum communications, initially developed for military use to enhance secure communications. Spread spectrum systems spread a signal over a wider frequency band than the original message while transmitting at the same signal power, making it harder to intercept or jam. This tutorial covers an introduction to RF, wireless and high-frequency signals and systems. It shares key techniques such as Frequency Hopping (FH) and Direct Sequence Spread Spectrum (DSSS), with a focus on DSSS due to its widespread industry use. It explains the process of spreading and despreading signals, the role of m-sequences in generating pseudonoise sequences, and touches on advanced topics like Gold sequences and Walsh-Hadamard sequences for enhancing the capacity and security of spread spectrum systems.
Contents
- Introduction
- General Block Diagram
- Direct Sequence Spread Spectrum (DSSS)
- Spreading and Despreading
- Conclusions
- References
- Related Products
Introduction
Spread Spectrum refers to a system originally developed for military applications, to provide secure communications by spreading the signal over a large frequency band.
Figure 1 represents a narrow band signal in the frequency domain. These narrowband signals are easily jammed by any other signal in the same band. Likewise, the signal can also be intercepted since the frequency band is fixed and narrow (i.e. easy to detect).
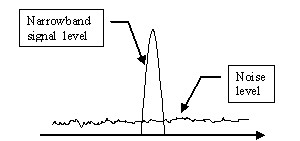
Figure 1: Narrow band signal, relatively easy to jam or intercepted.
The idea behind spread spectrum is to use more bandwidth than the original message while maintaining the same signal power. A spread spectrum signal does not have a clearly distinguishable peak in the spectrum. This makes the signal more difficult to distinguish from noise and therefore more difficult to jam or intercept. This concept is illustrated in Figure 3.
This document will explore basics concepts of spread spectrum for the remaining of the introduction and then it will explore the supporting concepts of the most used technique in spread spectrum systems. The last section will give the reader some insight of more advance topics but will not deeply explore them. We encourage the reader to seek the references for advance knowledge of spread spectrum systems.
General Block Diagram
We present now the block diagram of a typical communication system with the difference that the modulator/demodulator has as input the spreading generator. This piece will be explored in following sections.
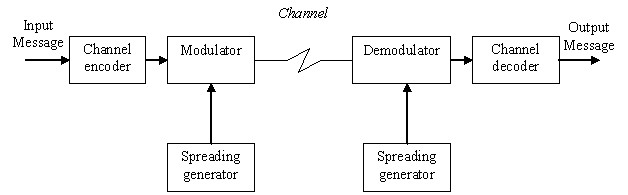
Figure 2: Block diagram of the spread spectrum communication system
There are two predominant techniques to spread the spectrum:
1) Frequency hoping (FH), which makes the narrow band signal jump in random narrow bands within a larger bandwidth.
2) Direct sequence (DS) which introduces rapid phase transition to the data to make it larger in bandwidth.
We will focus on Direct Sequence Spread Spectrum technique since it is the mostly used in the industry (CDMA, UMTS, 802.11, GPS).
Direct Sequence Spread Spectrum (DSSS)
Direct sequence spread spectrum (DSSS) introduces rapid phase transition to the data making it larger in bandwidth. As the period T of a signal gets shorter in time (or rate R increases), the bandwidth B of the signal increases: R = 1/T = 2B (Nyquist Rate)
The following figures explain it:
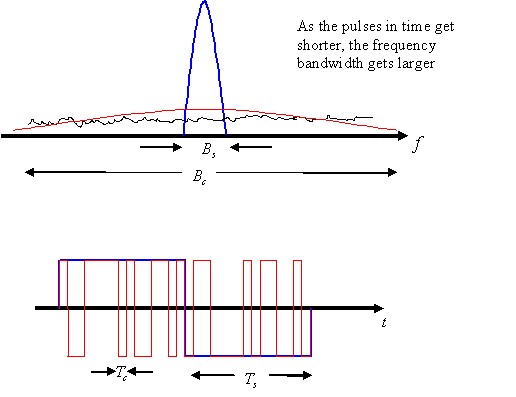
Figure 3: Rate and period are related to bandwidth by when pulse shaping is used.
Spreading and Despreading
The rapid phase transition (chip rate ) signal has a larger bandwidth given that the rate is greater (without changing the power of the original signal) and behaves similar to noise in such a way that their spectrums are similar for bandwidth in scope. In fact, the power density amplitude of the spread spectrum output signal is similar to the noise floor. The signal is “hidden” under the noise.
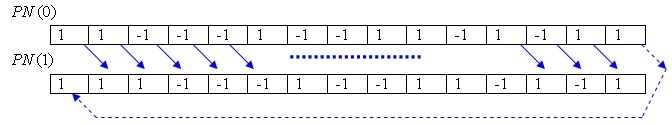
To get the signal back, the exact same high bandwidth signal is needed. This is like a key, only the demodulator that “knows” such a key will be able to demodulate and get the message back. This “key” is in fact a pseudo random sequence (rapid phase transition) also known as pseudo noise (PN). These sequences are generated by m-sequences.
m-Sequences.
These codes (DSSS codes) will all be treated as pseudonoise (PN) sequences because resembles random sequences of bits with a flat noiselike spectrum.
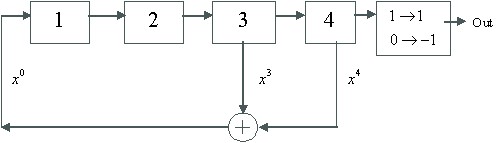
This sequence appears to have random pattern but in fact can be recreated by using the shift register structure in Figure 4 with M=4, polynomial and initial state ‘1 1 0 0’.
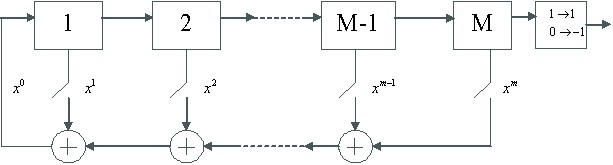
Figure 4: Shift register structure for m-sequence
Where ‘’ represent modulo 2 addition.
Using this scheme, the initial state is only needed to generate exactly the same sequence of length (the only forbidden state is all zeros since the register will lock in this state).
Take for example:
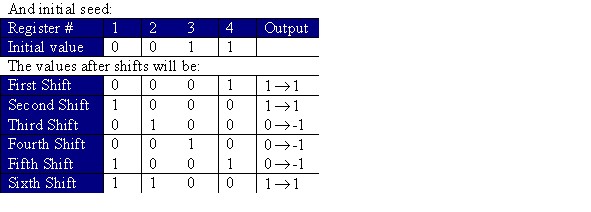
The final sequence will look like this,
1 1 -1 -1 -1 1 -1 -1 1 1 -1 1 -1 1 1
After the fifteenth shift, the values on the registers will be again the starting seed.
Properties of m-Sequences
Period:
After this number of ‘1’ and ‘-1’ the sequence will start to repeat since the starting symbols will be the same.
Autocorrelation:
The formal definition of discrete autocorrelation is:
Consider the previous sequence
| 1 | 1 | -1 | -1 | -1 | 1 | -1 | -1 | 1 | 1 | -1 | 1 | -1 | 1 | 1 |
If we perform the following operation:
= 15 which is multiply each value by itself and add them all (
).
Now take ,
Performing the same operation:
= -1 =
This is the autocorrelation for each shift point. If we take them all and plot them so that there are 15 points before 0 and 15 after:
a)
b)
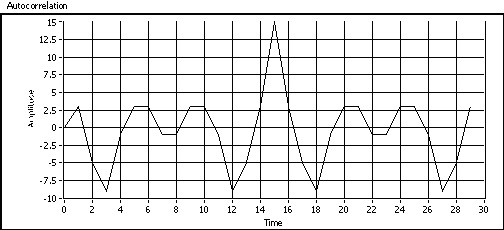
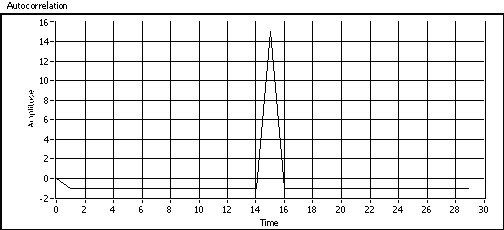
Figure 5: Correlation of a) example sequence and b) other sequence with polynomial created with LabVIEW and MathScript
As seen, only if the end user having the exact sequence is able to demodulate the message when the sequence is synchronized (peak at correlation = 1). Other users will have very little amplitude of the original signal. This is the principle of Code Division Multiple Access (CDMA) cellular systems, in other words, share the same frequency and time with multiple users with different codes.
Spreading
The block diagram of the DSSS communication system for QPSK is presented in Figure 6. Notice that the PN sequence is introduced here to both in-phase (I) and quadrature (Q) components.
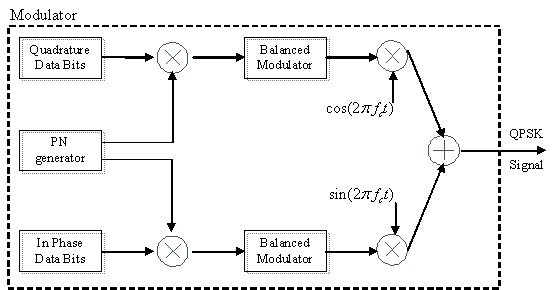
Figure 6: Block diagram of the spread spectrum QPSK modulator
The sequence should be long enough (with respect to the message signal) to have the noise-like spectrum. This is the relation between spreading sequence rate and message rate
:
In practical systems, is an integer number and it is the number of phase shift of the PN sequence for each message bit. For example, for GPS systems N = 1024.
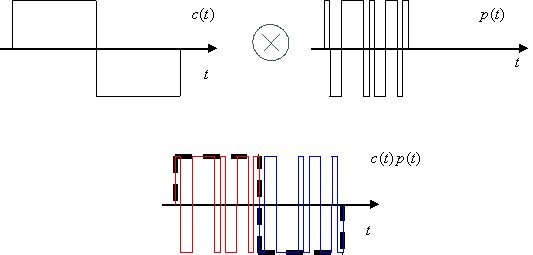
Figure 7: Spreading the message, each bit of the message will contain the entire PN sequence
The new message has now and therefore
The output combined baseband sequence is:
Where is the sent baseband waveform,
is the PN waveform and
is the bit sequence.
Despreading
Received baseband waveform is the combination of the transmitted waveform and noise in the channel.
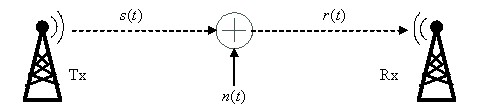
Figure 8: Simple additive white Gaussian noise (AWDG) channel model. LabVIEW Vi
The received signal will be combined again with the spreading sequence. Notice that the noise is also going to be processed on the same procedure but correlation properties will not increase the noise power.
The received signal will be the combination of the transmitted signal plus noise:
We can substitute the sent waveform by the combination of the PN sequence and the bit sequence.
The modulator will multiply it by the PN sequence:
If is synchronized,
and
is like multiplying noise times noise which gives other kind of noise
(similar in amplitude).
Consider the ideal example from Figure 9.
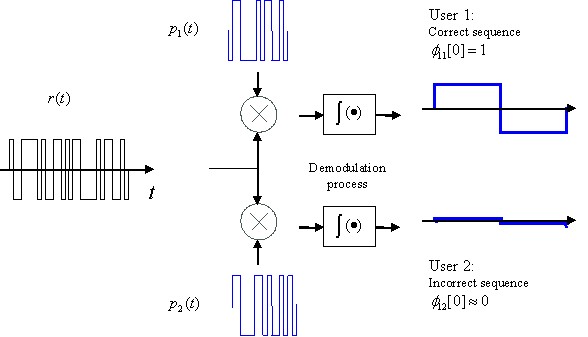
Figure 9: Recuperate original signal for two different users. User 1 has the correct sequence. User 2 has different sequence and therefore the output message will have many errors (no information)
M-sequences are the basics of PN sequences and they are used in real systems (GPS) but these are not the only PN sequences. Since Spread Spectrum is the basis of CDMA, we will highlight the basis of two of the most used sequences involved in the system: Gold sequences (WCDMA) and Walsh-Hadamard sequences (IS-95).
Gold Sequences
Gold sequences help generate more sequences out of a pair of m-sequences giving now many more different sequences to have multiple users. Gold sequences are based on preferred pairs m-sequences. For example, take the polynomials and
:
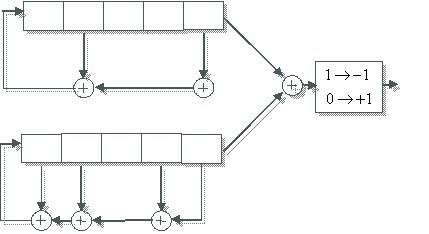
Figure 10: Example of gold sequence generator using one preferred pair of m-sequences: and
Remember m-sequences gave only one sequence of length. By combining two of these sequences, we can obtain up to 31 (
) plus the two m-sequences themselves, generate 33 sequences (each one length
) that can be used to spread different input messages (different users CDMA).
The m-sequence pair plus the Gold sequences form the
available sequences to use in DSSS. The wanted property about Gold codes is that they are balanced (i.e. same number of 1 and -1s).
Walsh-Hadamard Sequences
Other common sequences are Walsh-Hadamard sequences currently used in CDMA systems. These sequences are orthogonal (i.e. where
is a row of the matrix), convenient properties for multiple users. The sequences are the rows of the Hadamard matrix
defined for
as:
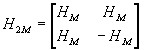
For larger matrices use the recursion:
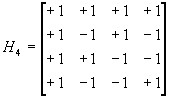
Example for
Orthogonal codes have perfect properties of cross correlation (if no shift is implemented).
Conclusions
We have now explored different sequences that can spread the signal like noise would behave. Spread spectrum systems expand beyond this point to many different paths: modulation schemes, performance under fading, under interference, capacity in CDMA systems, etc.
To finalize, we would like to point out the advantages and disadvantages of using spread spectrum:
Advantages:
- Privacy. Secure communications because signal is “hidden” like noise
- Non interference with other signals in the same band.
- Possible to share frequency and time at same time (CDMA)
- Protection against jamming
Disadvantages:
- Increase bandwidth (wideband circuitry, channel model for wideband systems behaves different over frequency)
- Increase complexity
References
[1] G. L. Stüber, “Principles of mobile communication,” Kluwer Academic, Boston 1996.
[2] J. G. Proakis, “Digital Communications,” 4th Edition, McGraw-Hill Higher Education.
[3] T. S. Rappaport, “Wireless communications: principles and practice,” Pentrice Hall PTR, N.J., 1996.
[4] T. Pratt, C. W. Bostian and J.E. Allnutt, “Satellite Communications,” 2nd ed. John Wiley publication, 2002.
[5] R: Prasad, T. Ojanperä, “An Overview of CDMA Evolution Toward wideband CDMA,” IEEE communications surveys, Vol. 1, No. 1 Q4 1998.
Related Products
PXI Vector Signal Analyzer
NI RF Switches
The National Instruments RF switch modules are ideal for expanding the channel count or increasing the flexibility of systems with signal bandwidths greater than 10 MHz to bandwidths as high as 26.5 GHz.
LabVIEW
National Instruments LabVIEW is an industry-leading graphical software tool for designing test, measurement, and automation systems.