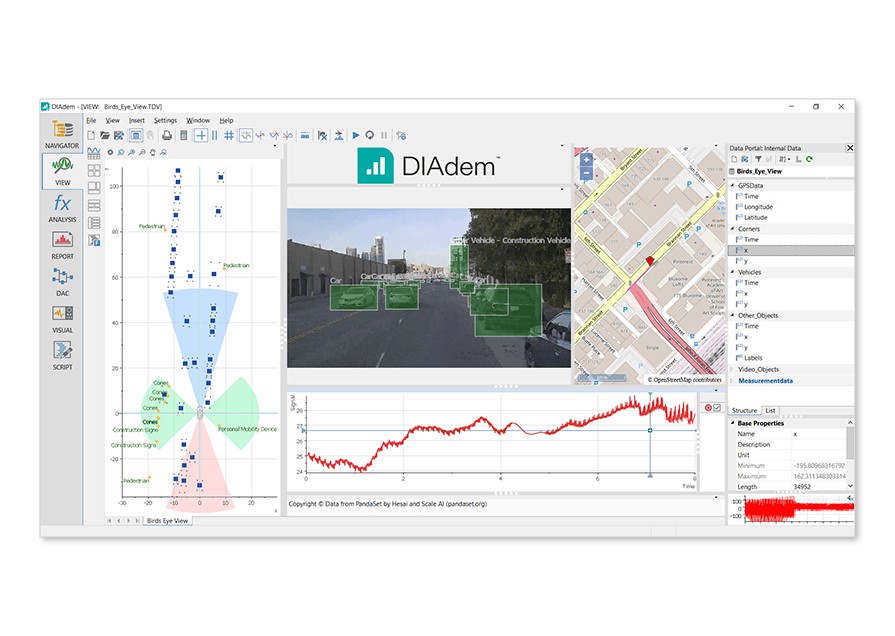
What’s New in NI DIAdem
The latest version of NI DIAdem introduces new features and tools for test data management.
DIAdem 10.2 Features
-
Support for Microsoft Windows Vista
DIAdem NAVIGATOR, DataFinder, and Data Portal
-
Use the channel preview to graphically display channel data within the properties window
DIAdem ANALYSIS
-
Take advantage of new functions for calculating process capability indexes
DIAdem Report
-
Create master layouts to save sections of a layout to be used in other report templates
DIAdem 10.1 Features
View an online demonstration highlighting several new features introduced in DIAdem 10.1
DIAdem DataFinder
-
Extend data management for large groups with the New NI DataFinder Server Edition
-
Use custom date/time properties and query them in the DataFinder
-
Search faster with optimized indexing of specific custom properties
-
View all available search values or ranges for an optimized property in an enumerated list making it even easier to create queries
-
Compare both data and time in one property to narrow in on your test data
-
Build new queries faster by dragging properties into the conditions table from the NAVIGATOR property table and ResultsList
DIAdem NAVIGATOR and Data Portal
-
Features TDM Streaming file format, which can be written in LabVIEW, LabVIEW Real-Time, LabWindows/CVI, and LabWindows™/CVI Real-Time
-
Load your ASCII files with custom group and channel properties with the redesigned ASCII DataPlugin Wizard
-
Load large data sets faster with Reduced data loading
-
Copy and paste entire groups in the Data Portal
-
Simultaneously edit multiple properties across multiple channels
DIAdem VIEW
-
Immediately visualize all your loaded data channels with the Dynamic Channel Table display
-
Interactively create, edit, and resize channels by typing directly into the channel table
-
Quickly zoom into areas of interest on a graph with new and simplified zooming features
DIAdem ANALYSIS
-
Execute your existing LabVIEW MathScripts or create your own from scratch
-
Automatically store single value results from analysis in custom properties that can then be indexed for searching
-
Take advantage of VBScript functions used in DIAdem SCRIPT in your Calculator formulas
-
Improved performance of several analysis functions
DIAdem REPORT
-
Select objects on your report easily with automatic highlighting of the object over which you are hovering
-
Display XY error bars at each curve point in your report
-
Interactively rotate 3D graphs directly from your report to choose the best display angle
-
Automatically plot interpolated 3D surfaces with the new “Characteristic Diagram” curve option
-
Display multicolumn 2D and 3D axis legends for your graphs
DIAdem SCRIPT
-
Execute LabVIEW VIs directly from DIAdem Script for custom analysis and data acquisition
-
Incorporate new DIAdem User Events such as OnPanelChanged(), OnFileLoading(), OnSearched(), and many more to customize the DIAdem environment
Reader Comments | Submit a comment »
Legal
This tutorial (this "tutorial") was developed by National Instruments ("NI"). Although technical support of this tutorial may be made available by National Instruments, the content in this tutorial may not be completely tested and verified, and NI does not guarantee its quality in any way or that NI will continue to support this content with each new revision of related products and drivers. THIS TUTORIAL IS PROVIDED "AS IS" WITHOUT WARRANTY OF ANY KIND AND SUBJECT TO CERTAIN RESTRICTIONS AS MORE SPECIFICALLY SET FORTH IN NI.COM'S TERMS OF USE (http://ni.com/legal/termsofuse/unitedstates/us/).
